Beyond Points: Spherical Distributional Part Prototypes for Interpretable Classification

Duarte Leão1,2 · Diogo Pereira Araújo1,2 · Catarina Barata1 · Carlos Santiago1

1 Instituto Superior Técnico, Universidade de Lisboa 2 Carnegie Mellon University

Paper Code

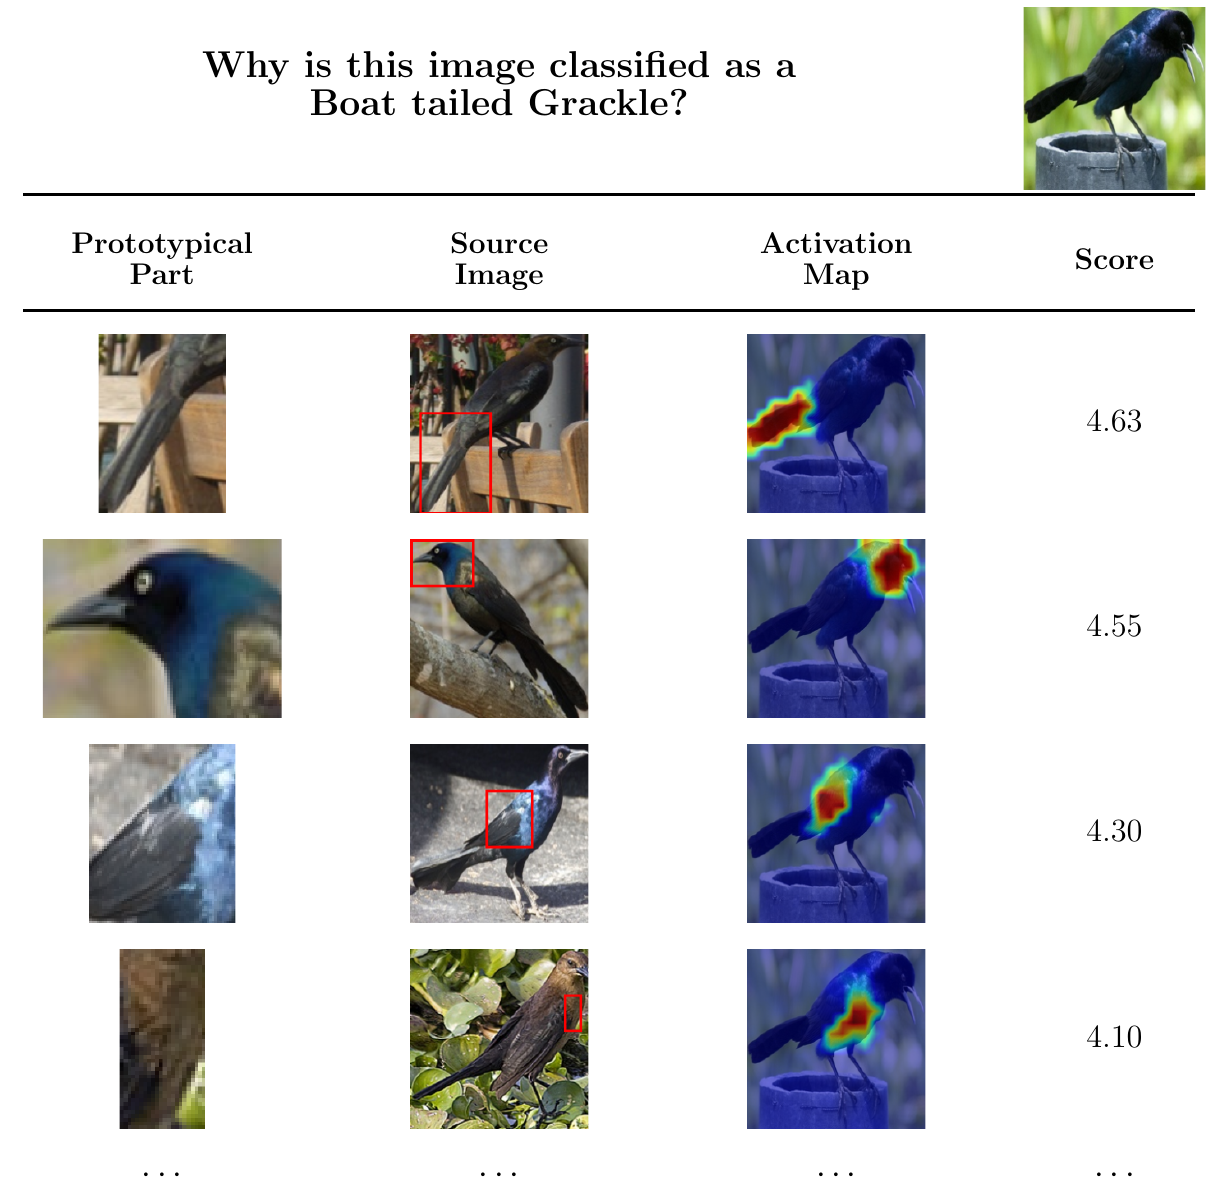
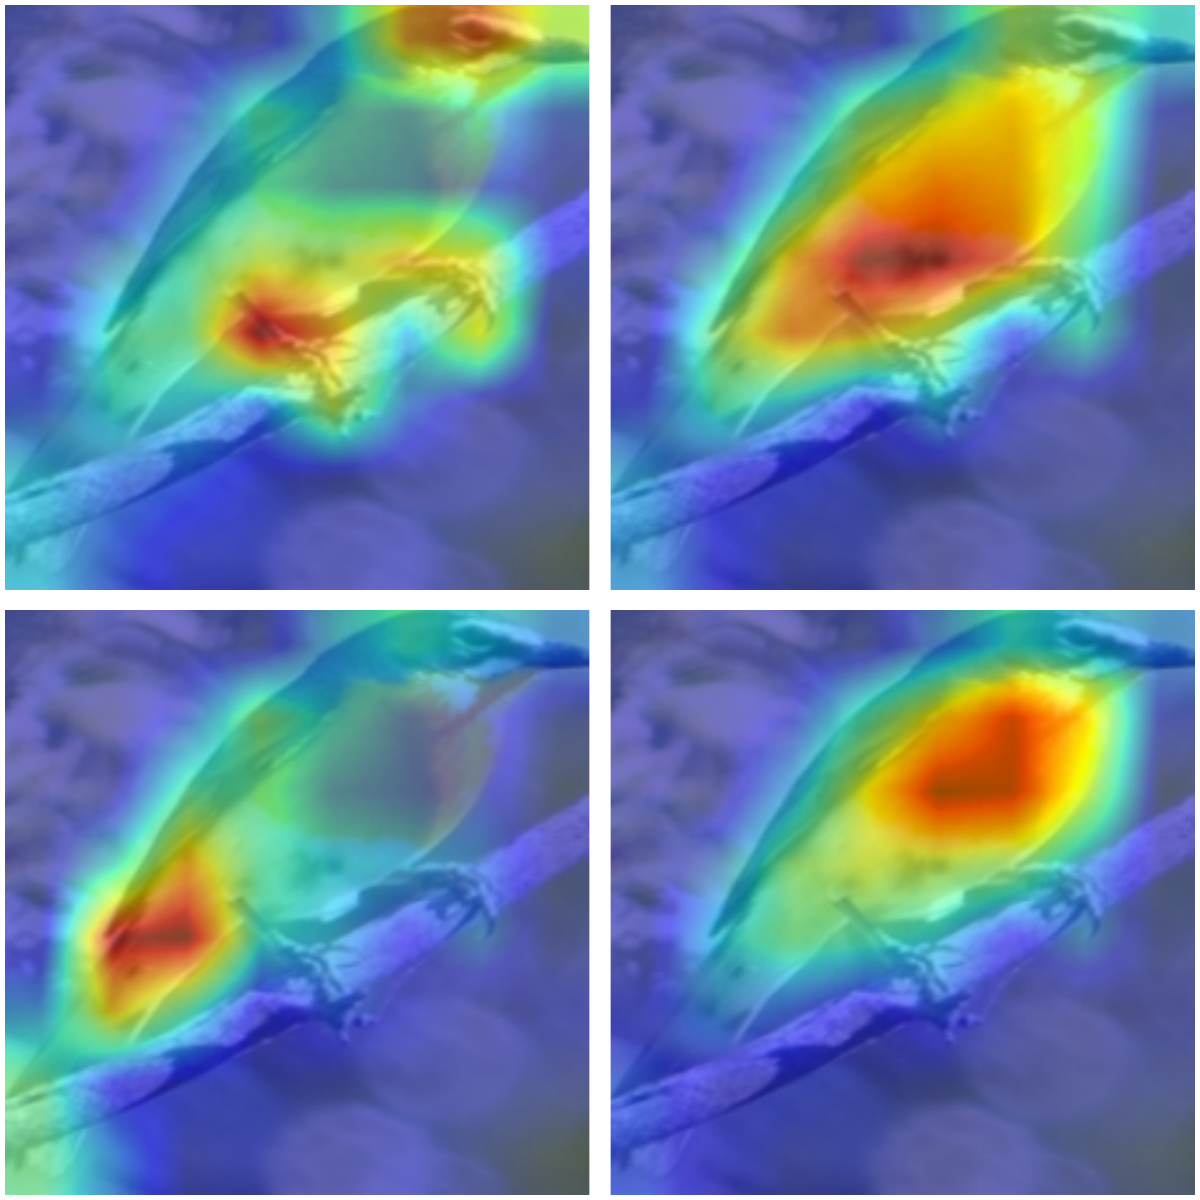
Baseline point-prototype top-4 activation panels; cycles across CUB, Dogs, and Cars examples.
Baseline CUB - Example 1
Point-prototype baseline: broader and partially redundant evidence.
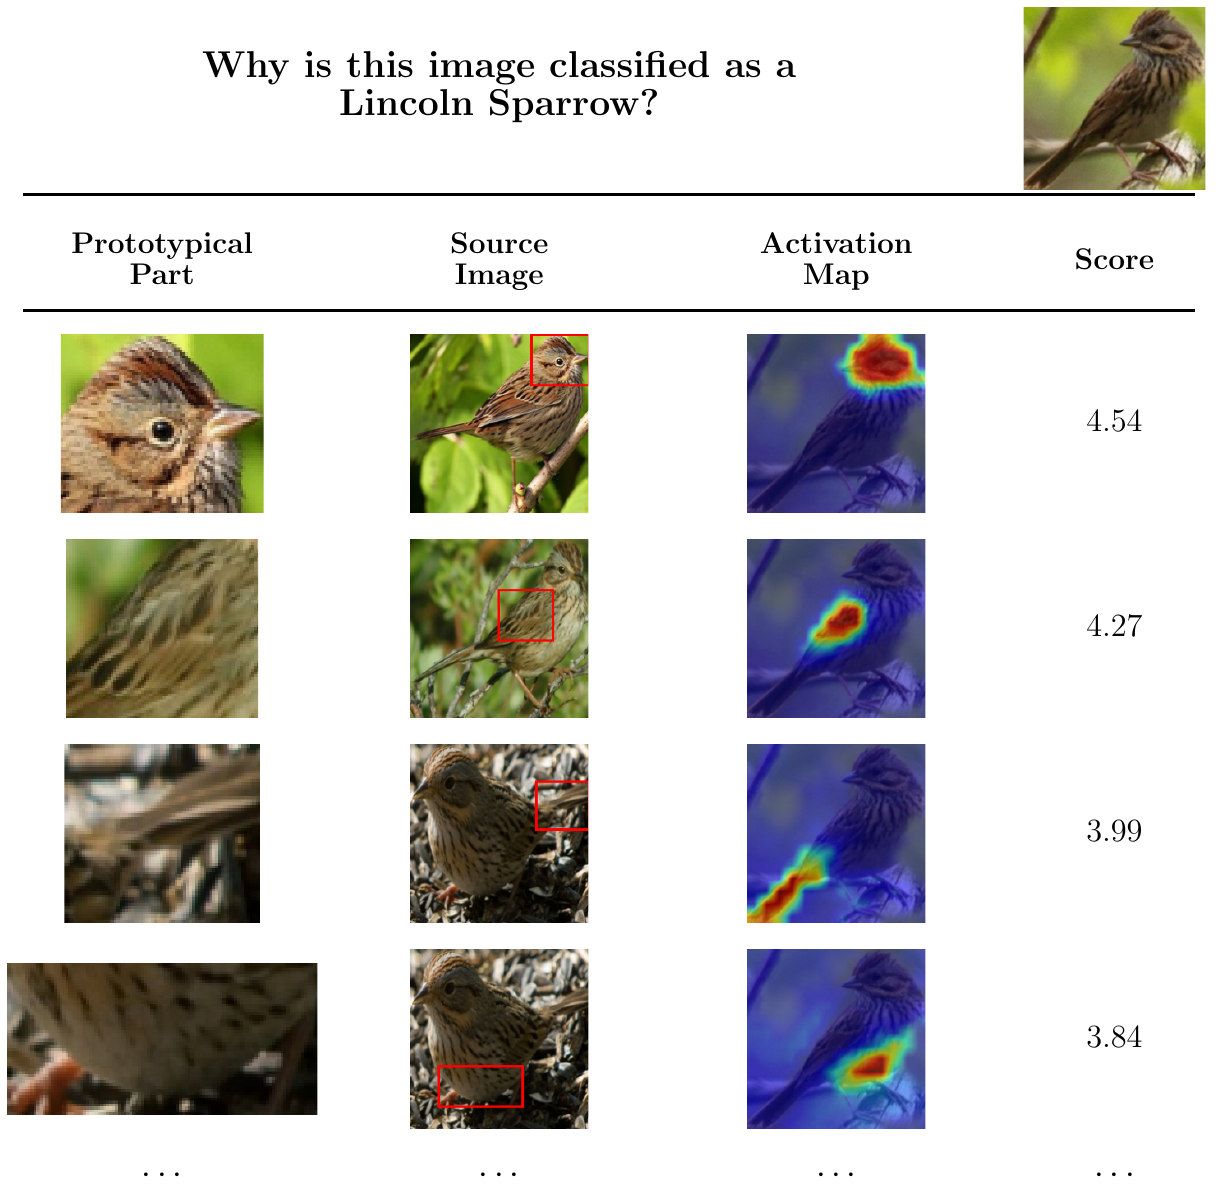
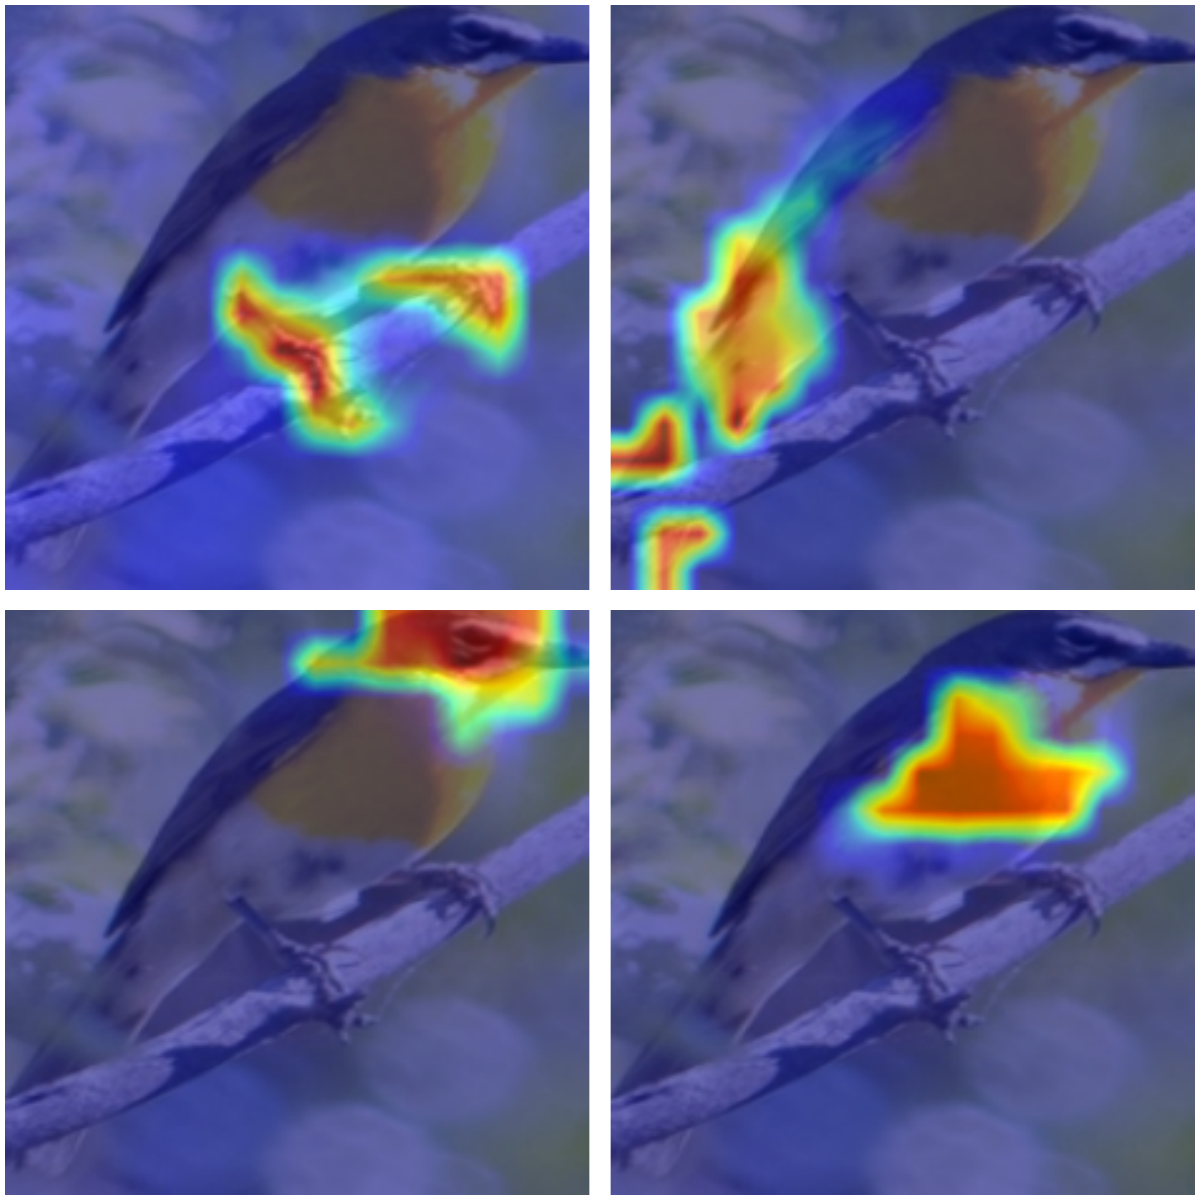
vMFProto top-4 activation panels; cycles across the same CUB, Dogs, and Cars examples.
vMFProto CUB - Example 1
vMFProto: sharper and complementary part evidence.

Distributional prototypes improve localization and reduce prototype redundancy by modeling part-level variability directly on the hypersphere.

  • Sharper localization: prototypes concentrate on semantically meaningful parts.
  • Less redundancy: assignments are more complementary across top evidences.
  • Competitive accuracy: explanation gains come without sacrificing classification performance.

Abstract

Prototype-based classifiers are interpretable, but point prototypes can become redundant or unstable in normalized feature spaces. We introduce vMFProto, which models each class as a mixture of directional (vMF) prototypes on the unit sphere, with a learnable concentration (\(\kappa\)) per prototype to capture rigid versus variable parts. We build on entropic OT-based patch-to-prototype assignments for structured coverage, and combine them with end-to-end refinement, patch-level distillation, and distribution-aware diversity regularization. On CUB-200-2011, Stanford Dogs, and Stanford Cars with frozen DINO backbones, vMFProto achieves state-of-the-art explanation quality on CUB and competitive classification accuracy across datasets.

Main Contributions

  • Directional, distributional prototypes aligned with normalized DINO feature geometry.
  • Prototype-specific concentration (\(\kappa\)) models part-specific variability.
  • OT-based assignment, combined with our vMF modeling and refinement losses, improves consistency, stability, and distinctiveness.

Method

vMFProto combines spherical distribution modeling with structured patch assignment and lightweight backbone adaptation.

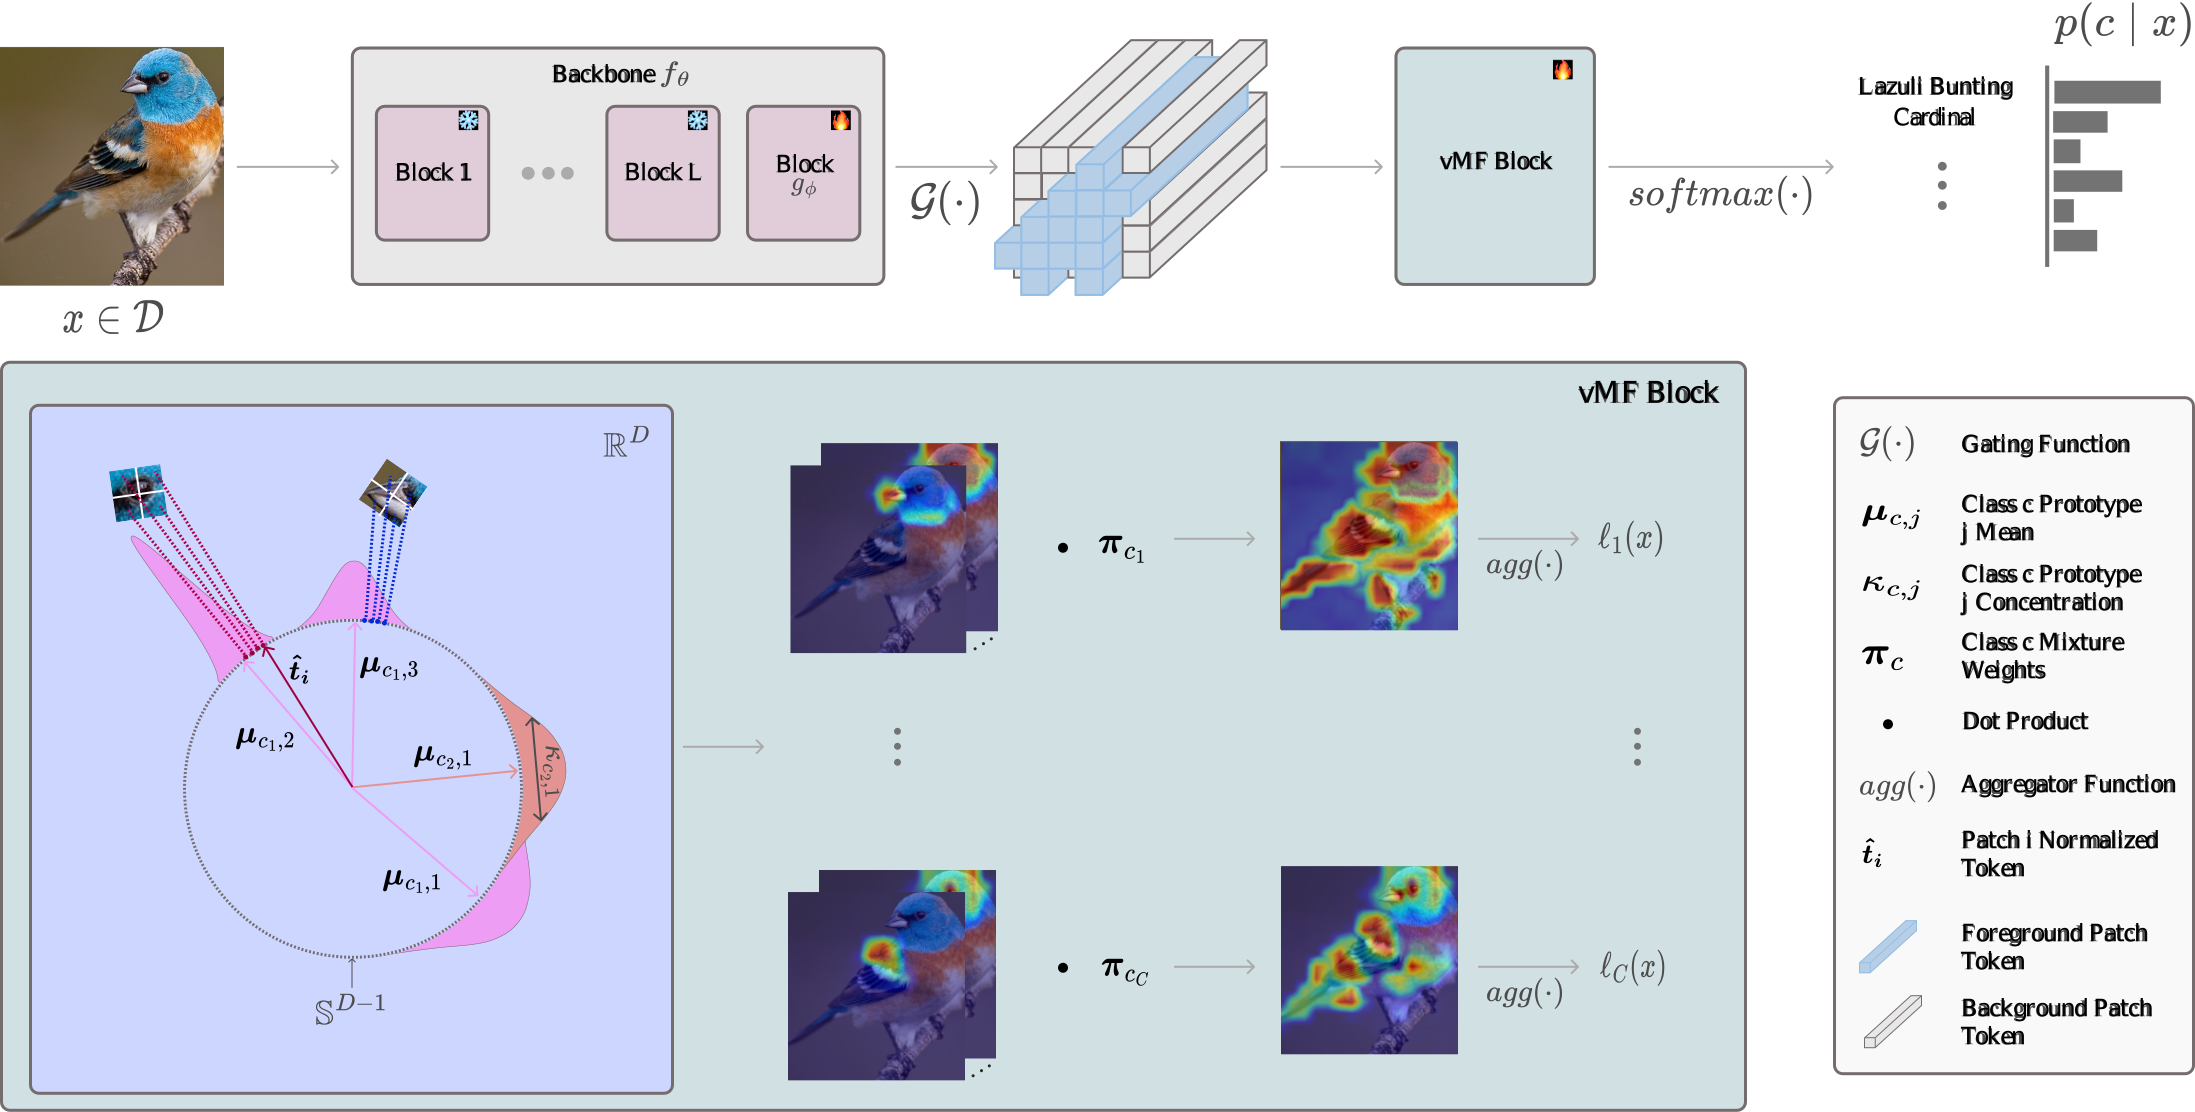
End-to-end vMFProto architecture: frozen DINO features, trainable expansion block, attention-to-PCA foreground gating, class-conditional vMF mixtures, OT assignment, and refinement losses.
vMFProto pipeline: gated foreground tokens are normalized on \(\mathbb{S}^{D-1}\), scored against class-conditional vMF prototypes \((\mu_{c,j}, \kappa_{c,j}, \pi_c)\), aggregated into class logits, and softmaxed for prediction.

Method Highlights

  • Unit-sphere geometry: normalize patch tokens and model them as directional data.
  • Learnable \(\kappa\) per prototype: sharp prototypes for rigid parts, broad prototypes for variable parts.
  • OT + refinement: entropic OT assignments, then end-to-end refinement with distillation and diversity.

Key differences vs. prior prototype models

Prior assumption Limitation vMFProto change
Point prototypes Redundancy and brittle matches. Distributional prototypes (vMF)
Fixed dispersion Cannot adapt part variability. Learn \(\kappa\) per prototype
OT-only assignment Coverage but overlapping prototypes. OT-based assignment + learnable dispersion + diversity

Results

Comprehensive quantitative comparison across CUB, Stanford Dogs, and Stanford Cars using the same evaluation protocol as the paper.

Legend: Con. = consistency, Sta. = stability, Dis. = distinctiveness, Acc. = top-1 accuracy.

CUB-200-2011 Main Comparison (Table 1)
Method J DINOv2 ViT-B/14 DINOv3 ViT-B/16
Con. Sta. Dis. Acc. Con. Sta. Dis. Acc.
ProtoPNet35.1757.4889.9458.3012.8367.8689.1578.29
57.8062.0589.6564.5210.7075.7788.4877.80
75.1461.8189.4346.1315.0774.3688.3979.39
Def. ProtoPNet319.8374.8174.1881.1025.6782.0182.3578.82
518.0073.6865.7486.4717.9073.5878.6585.07
728.5777.3153.5887.8727.0077.6472.3686.88
TesNet317.3363.5027.4688.0929.0062.8589.2184.79
528.0074.9337.3584.6736.9061.0162.8883.60
741.4376.5038.8386.3839.0765.6543.7983.76
EvalProtoPNet343.1767.9137.7080.4858.6776.1542.1779.69
553.7070.8936.6183.2870.3074.9326.4783.57
749.0070.8145.2680.5559.8674.8441.3882.24
MGProto34.6767.3353.5282.0829.3365.9646.3085.54
516.3068.3253.1783.1935.2061.6152.6785.97
77.7963.2212.8779.2417.2157.0311.6885.31
NPPP349.3379.2985.3790.5416.6790.6047.8277.18
559.5081.2779.9790.7810.0090.9648.2984.09
759.9382.0276.1591.1814.2990.7949.7985.73
vMFProto369.8377.3498.7290.2059.3377.5297.3790.06
578.7081.1896.9990.6677.3082.4094.9990.30
774.5082.5996.3790.8473.1483.1592.8889.78

Table 1: CUB-200-2011 comparison merging DINOv2 ViT-B/14 and DINOv3 ViT-B/16 into one table. Best values are bold; second-best are underlined.
Stanford Dogs Accuracy (Table 2)
Method J DINOv2 B/14 DINOv2 S/14 DINOv3 B/16 DINOv3 S/16
ProtoPNet338.6429.6581.8474.36
544.2239.6781.9177.16
748.9544.2881.9875.59
Def. ProtoPNet372.8671.5978.7965.21
578.5377.1781.1068.52
781.0878.2482.9774.50
TesNet381.5780.2383.8679.34
580.6477.9585.4978.53
779.2778.8785.4177.54
EvalProtoPNet380.7277.5279.9171.49
580.4177.1381.1272.56
779.5976.7581.6473.68
MGProto371.4869.9281.2977.79
576.4673.0482.6077.28
774.5072.3383.2376.27
NPPP387.6280.2184.7353.11
588.1682.3486.5960.05
788.0182.6087.1265.93
vMFProto388.0884.4687.4580.42
588.3184.0086.7279.78
787.6783.6887.1979.56

Table 2: Stanford Dogs top-1 accuracy (%) across B- and S-sized backbones for all methods and prototype budgets. Best is bold; second-best is underlined within each backbone column.

Stanford Cars Accuracy (Table 3)
Method J DINOv2 B/14 DINOv2 S/14 DINOv3 B/16 DINOv3 S/16
ProtoPNet310.436.2121.9177.73
59.709.9979.2779.87
710.287.1585.6678.45
Def. ProtoPNet386.8379.6080.4358.13
591.3985.6990.0967.93
791.4189.9092.2071.82
TesNet391.2286.9090.8187.85
590.4687.5184.9988.87
789.6786.8192.7989.75
EvalProtoPNet375.8971.8781.4080.06
578.9174.7482.8082.33
781.4673.6084.5081.54
MGProto32.3115.051.6885.75
585.0117.1993.3078.58
72.7580.2192.7685.70
NPPP388.3576.7767.4242.21
590.0483.3280.7050.24
790.6485.7486.1263.16
vMFProto392.7487.7493.8487.66
593.0987.2893.7887.09
793.2587.5893.5287.36

Table 3: Stanford Cars top-1 accuracy (%) across B- and S-sized backbones for all methods and prototype budgets. Best is bold; second-best is underlined within each backbone column.

CUB Anchor Ablations (Table 4)
Setting (DINOv2 B/14, J=5) Con. Sta. Dis. Acc.
vMFProto (full)78.7081.1896.9990.66
CE only56.5074.9689.0289.83
CE + PPD58.9074.6890.1890.35
CE + LogDet65.1079.6297.0488.42
Stage-2 off67.4076.7692.6189.47
Fixed \(\kappa\) = 571.6080.3296.0190.03
Fixed \(\kappa\) = 163.1079.4196.1789.23

Table 4: CUB anchor-setting ablations show that learned concentration, stage-2 refinement, and the combined objective are all important for explanation quality.

Across these settings, vMFProto remains consistently strong on explanation quality while staying competitive in classification accuracy across datasets and backbone families.


Qualitative Evidence


Activation maps indicate sharper, less redundant, and more semantically complementary prototype evidence.

CUB qualitative panel comparing prototype activation maps across methods, with vMFProto showing cleaner localization.
CUB qualitative comparison: vMFProto localizes parts with less overlap than representative baselines.

Why Tables

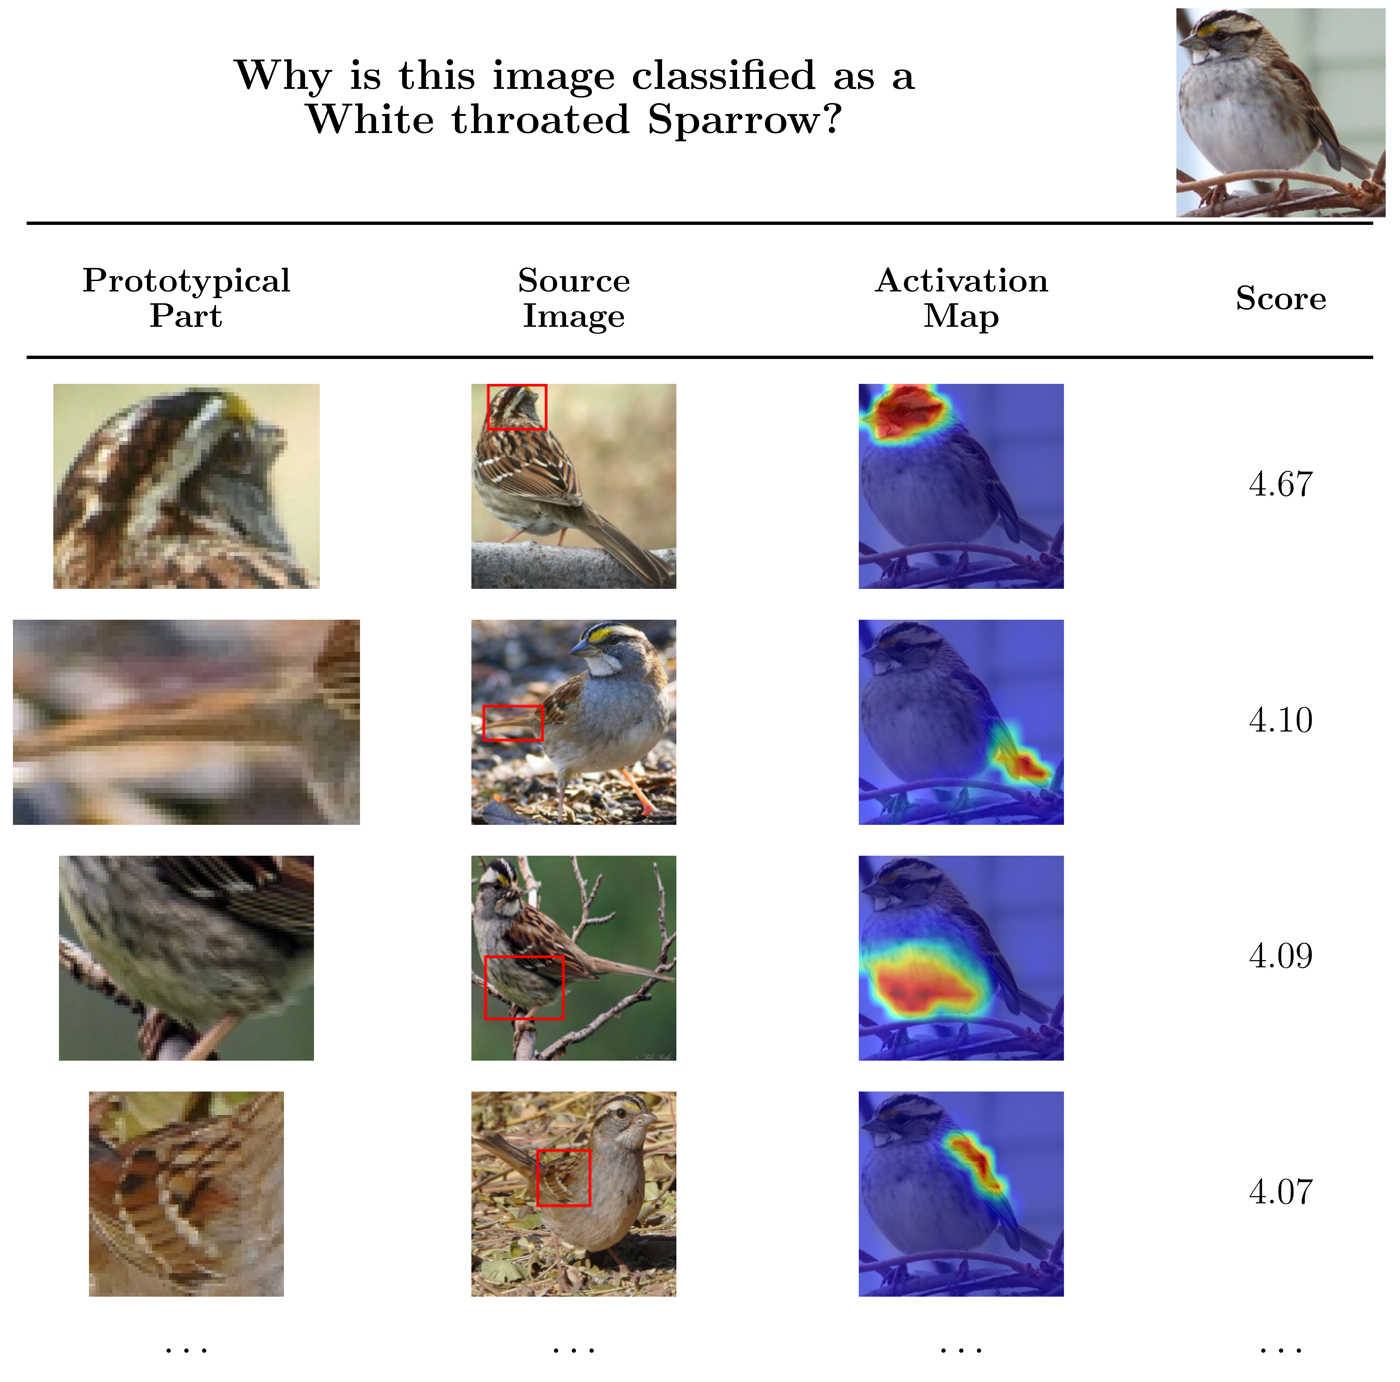
CUB why-table with top prototypical parts and contribution scores.
CUB: complementary bird-part evidence.
Additional CUB why-table example showing part evidence on head and wing regions.
CUB extra #1.
Additional CUB why-table example with complementary prototype responses over multiple bird parts.
CUB extra #2.
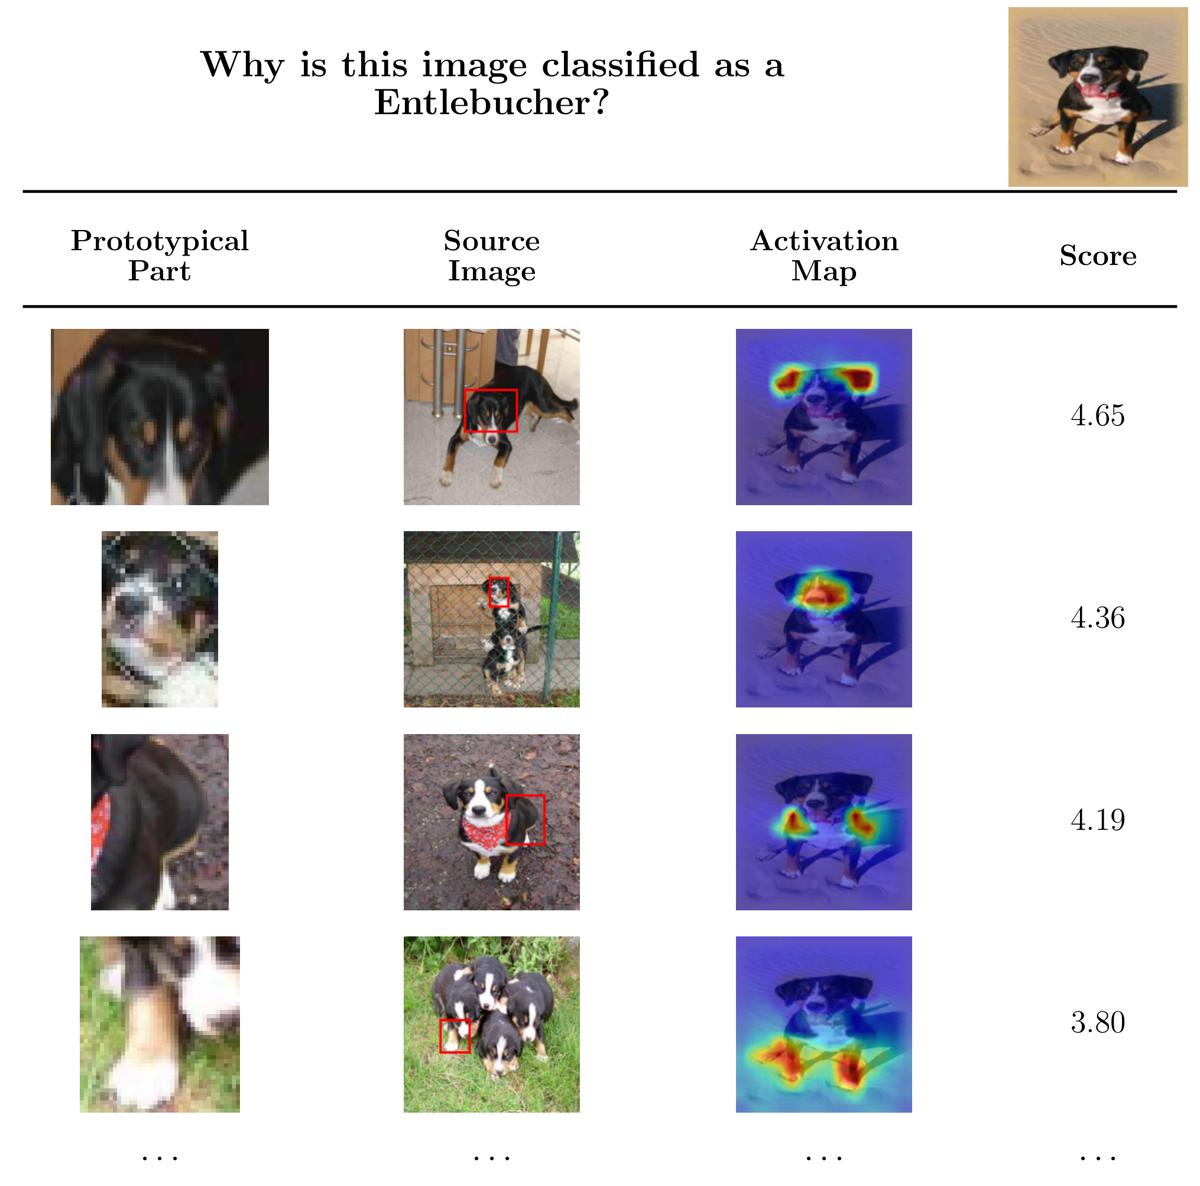
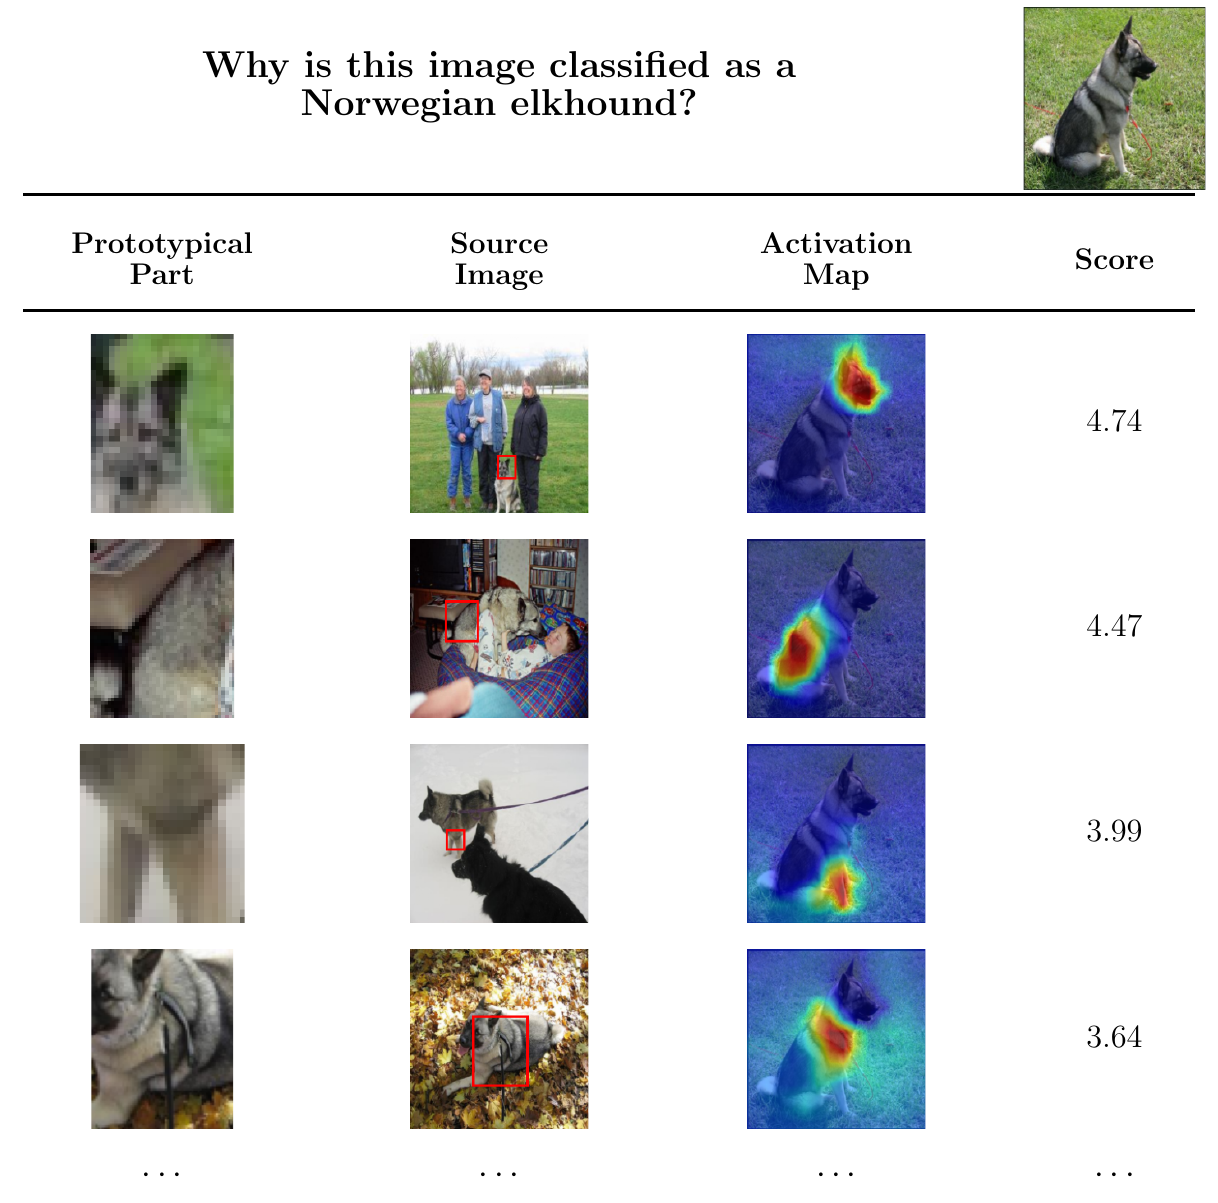
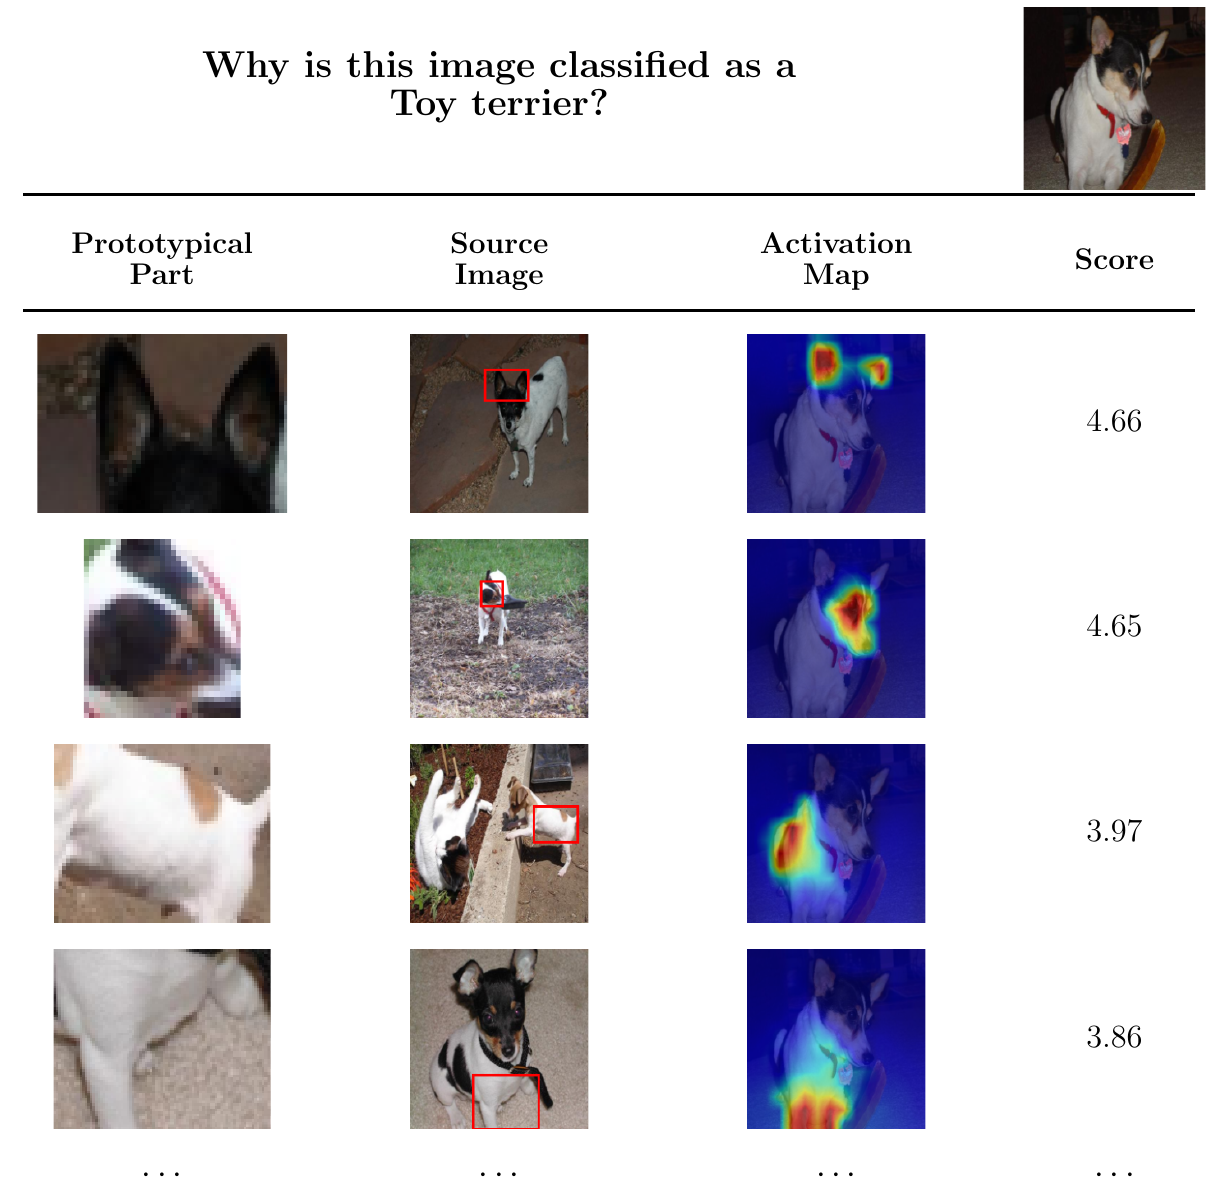
Stanford Dogs why-table with part-level evidence and contributions.
Dogs: localized facial/body cues.
Additional Dogs why-table example with concentrated activations around facial and torso cues.
Dogs extra #1.
Additional Dogs why-table example emphasizing complementary activations across body regions.
Dogs extra #2.
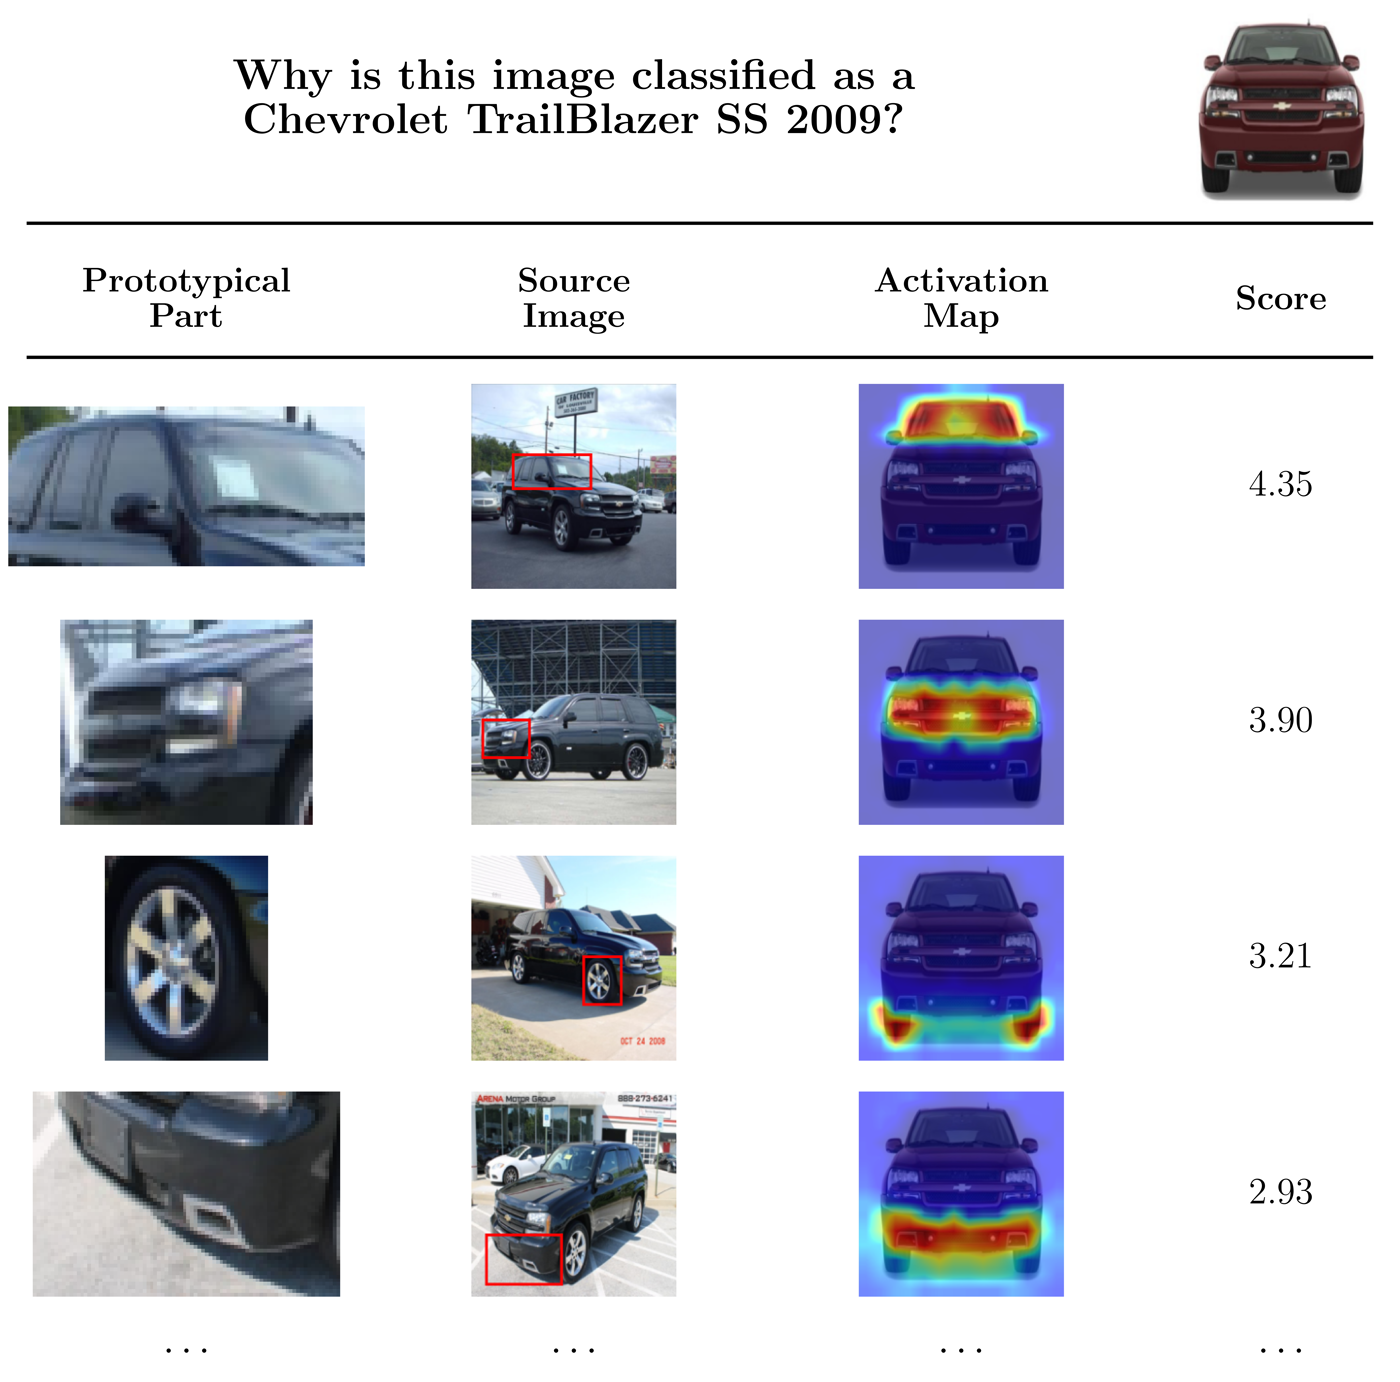
Stanford Cars why-table with top prototype activations and contributions.
Cars: discriminative front-detail activations.
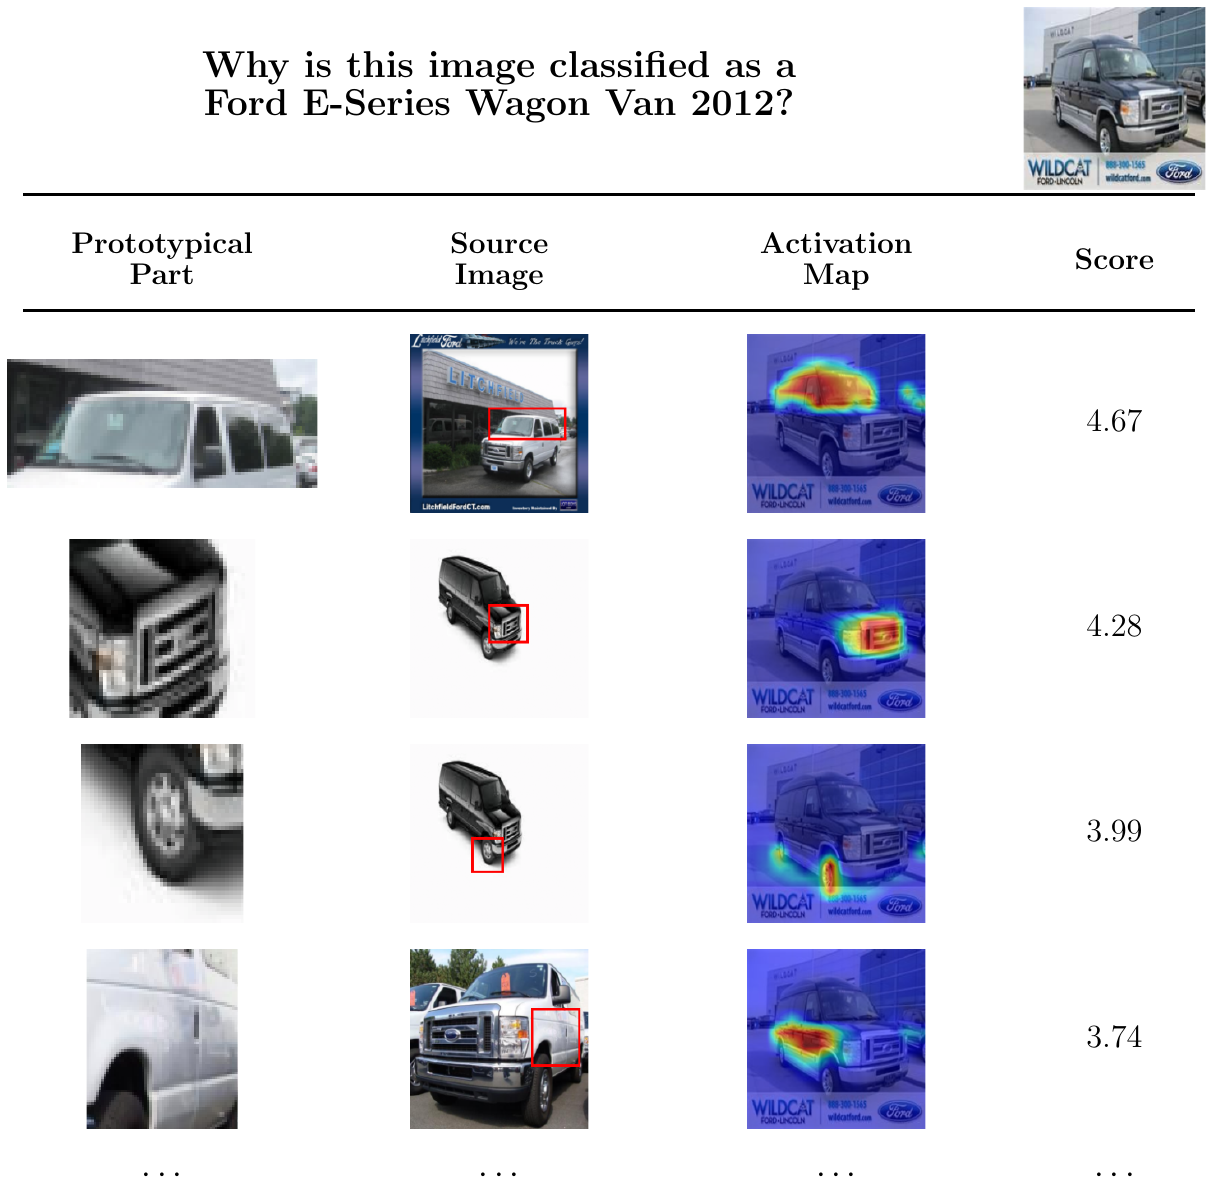
Additional Cars why-table example with strong evidence around grille and headlight structures.
Cars extra #1.
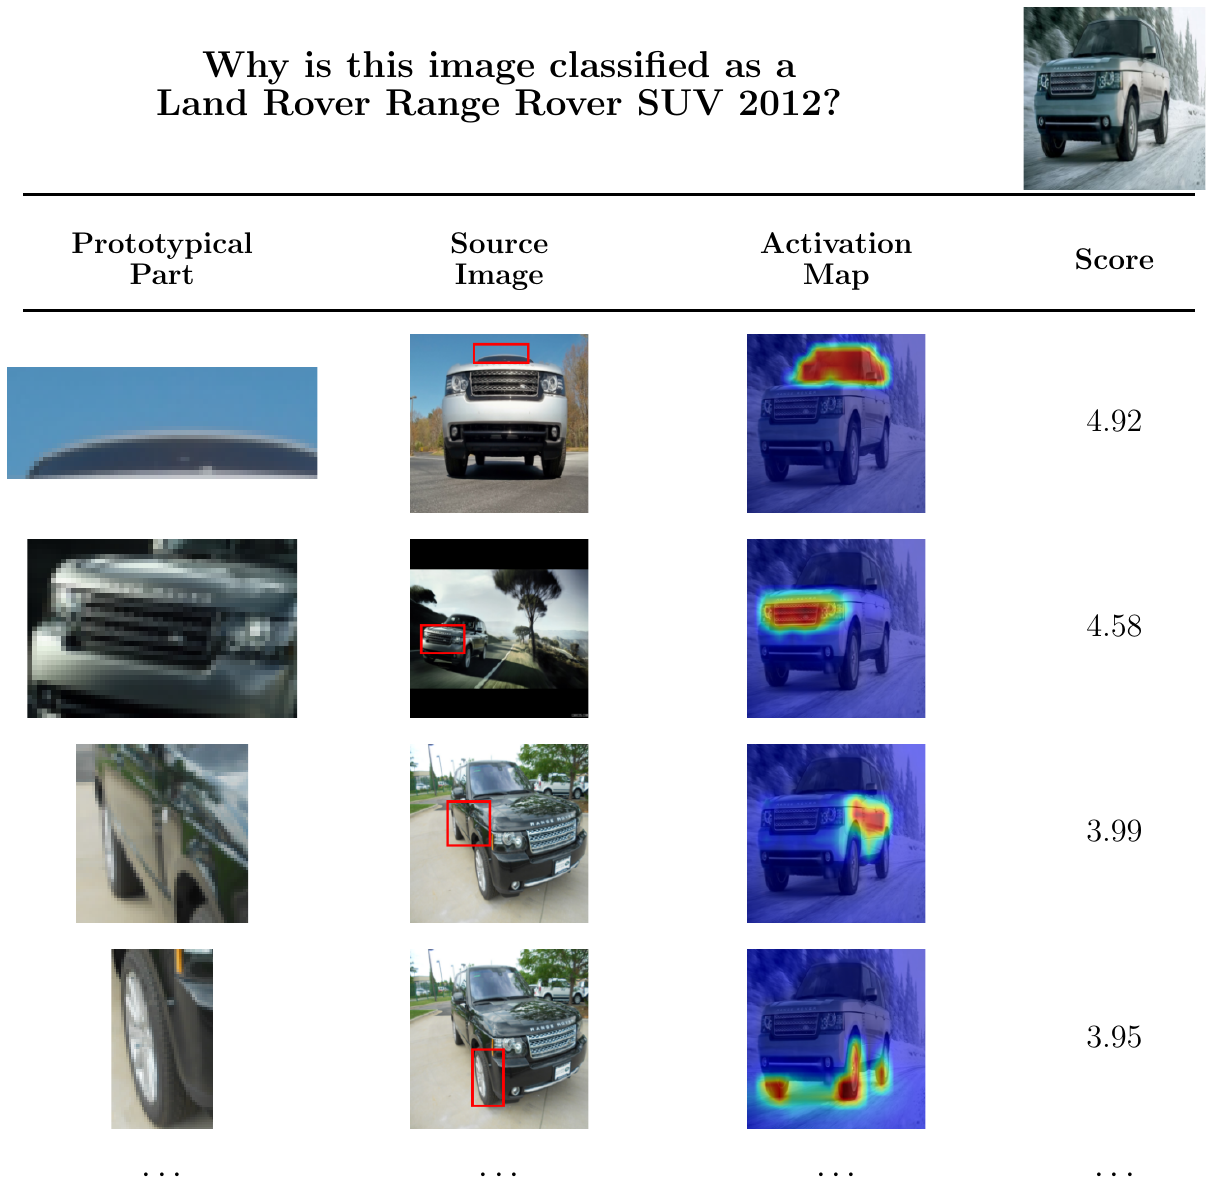
Additional Cars why-table example where evidence spans grille, hood, and wheel cues.
Cars extra #2.

Citation

If you use this work, please cite:

@misc{leão2026pointssphericaldistributionalprototypes,
  title={Beyond Points: Spherical Distributional Part Prototypes for Interpretable Classification},
  author={Duarte Leão and Diogo Pereira Araújo and Catarina Barata and Carlos Santiago},
  year={2026},
  eprint={2606.27582},
  archivePrefix={arXiv},
  primaryClass={cs.CV},
  url={https://arxiv.org/abs/2606.27582},
}